Appointment Performance Reports - 1st Appointments with New Prospects
LeadCenter offers dynamic dashboards with metrics that drive value for your financial advisory firm. One of these dashboards is 1st Appointments with New Prospects. This report presents metrics related to your first meeting with a new prospect. Many financial advisors see this first meeting as a make-or-break point which is why dissecting the elements of this meeting and obtaining real-time numbers is what this report will enable you to do.
Access Appointment Performance Reports - 1st Appointments with New Prospects
To access this report, follow these steps:
- Sign in to your LeadCenter.AI account.
- Click on Reports in the left navigation panel.
- In the Appointment Performance Reports section, click on 1st Appointments with New Prospects.
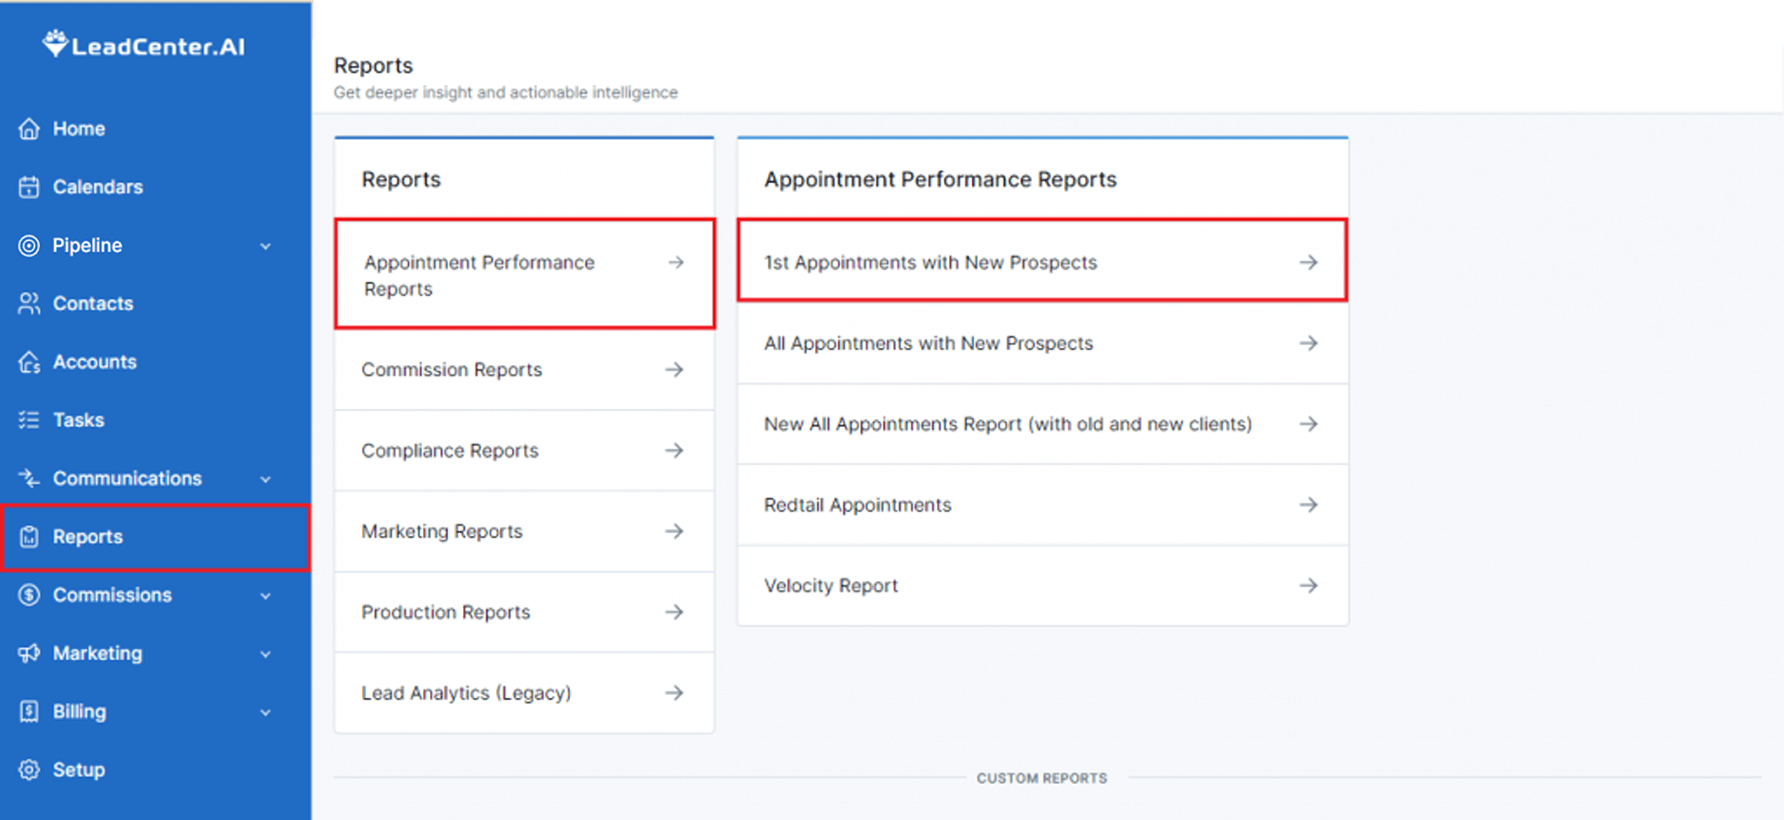
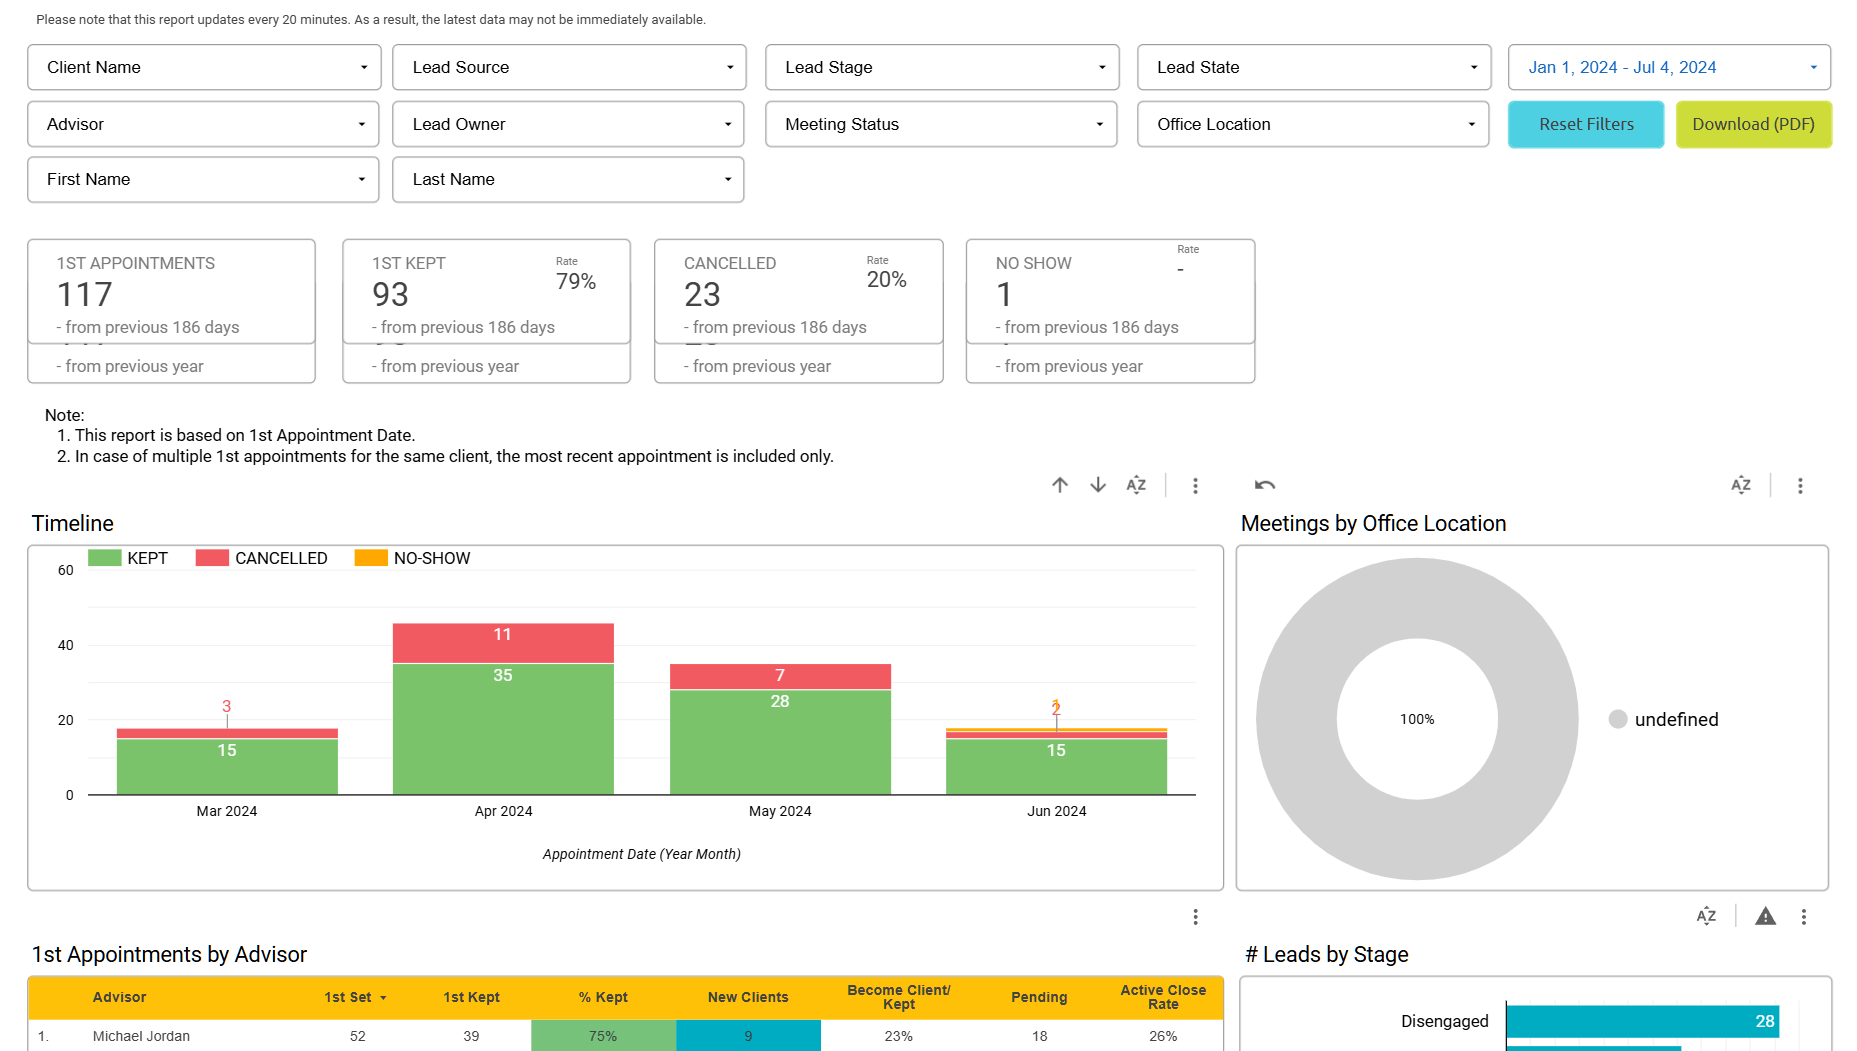
- You’ll see the dashboard:
Components
This report consists of different components such as filters, KPIs, charts, and graphs. Each of these components helps you gain a unique insight into the first meeting with a new prospect. Let’s see what these components are:
Filters
You’ll see different filters on top with drop-down menus to choose from. You can select as many filters as required. Let's take a look at these filters:

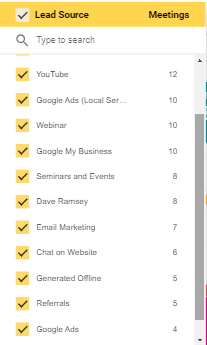
Lead Source
This filter shows where the leads are coming from. For example, YouTube, Facebook, Email marketing, etc.
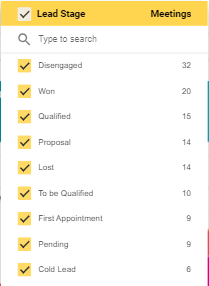
Lead Stage
Click on the drop-down menu to see all the stages of a lead’s journey. For example, Won, Lost, Qualified, Disengaged, etc. You’ll also see the number of leads in each stage.
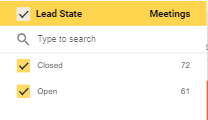
Lead State
Use this filter to select the state your lead is in. Selecting Open will show leads that are currently processing while selecting Closed will reveal leads that have been converted or lost.
Lead Owner
Click on the drop-down menu to select and see the lead’s owner. For example, if you select your name, you’ll see the leads that you brought.

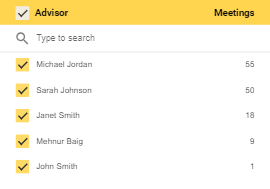
Advisor
Use this filter to search by financial advisors in your firm.
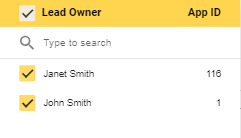
Lead Owner
Use this filter to see the advisors managing the leads.
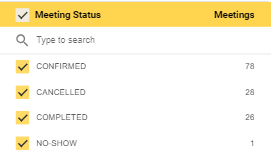
Meeting Status
This filter enables you to see the meeting status. For example, you can select the confirmed meetings, the no-shows, cancelled, and completed.
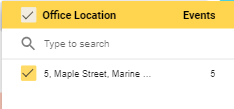
Office Location
Click on the drop-down menu to see the location of the office.
First Name
Use this filter to search by the first name.

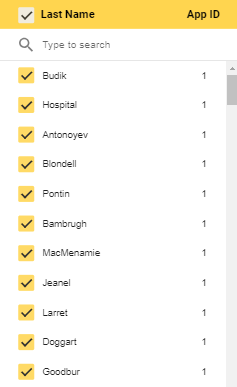
Last Name
Use this filter to search by last name.
Metrics
After filters, you’ll see the metrics in the middle of the screen. Each metric is represented with a dedicated tile.

Here’s a brief description of each of these metrics:
- 1st Appointments: The first meeting with the prospect.
- 1st Kept: The first appointment for which the prospect shows up.
- Cancelled: The scheduled appointments which were cancelled.
- No Show: The scheduled meeting for which the client didn’t show up.
Bar graphs
There are different bar graphs to visualize the elements of this report.
Timeline
This graph displays the number of appointments based on the day, month, year, and quarter. For instance, you made a total of 50 appointments in the month of June, out of which 42 were kept, 6 were cancelled, and 2 were no-shows.

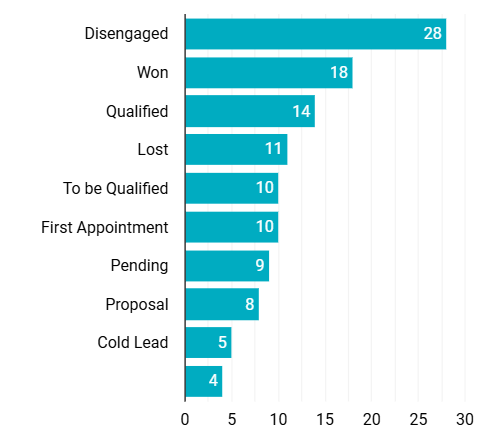
Leads by Stage
Here you can see the number of leads in various stages of the buyer’s journey. For example, 10 are qualified, 5 are disengaged, 7 are in the first appointment stage, etc.
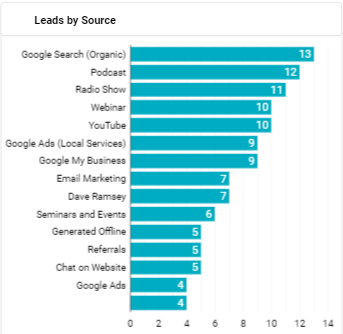
Leads by Source
This graph represents the number of leads generated from different sources. This enables you to view sources such as Google Ads, organic searches, referrals, etc.
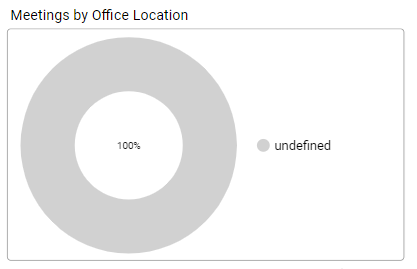
Pie chart representation
You'll see a pie chart that represents the percentage of meetings by office locations.
Tabular representation of 1st appointments
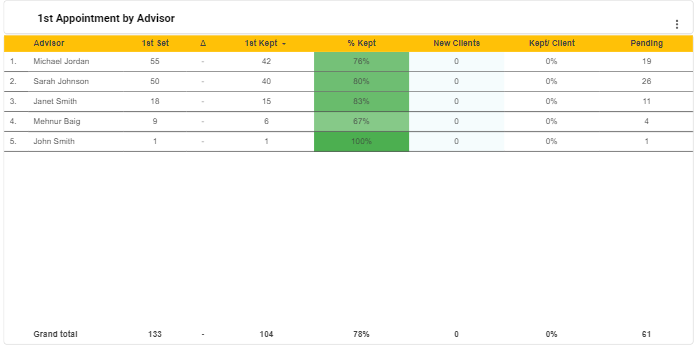
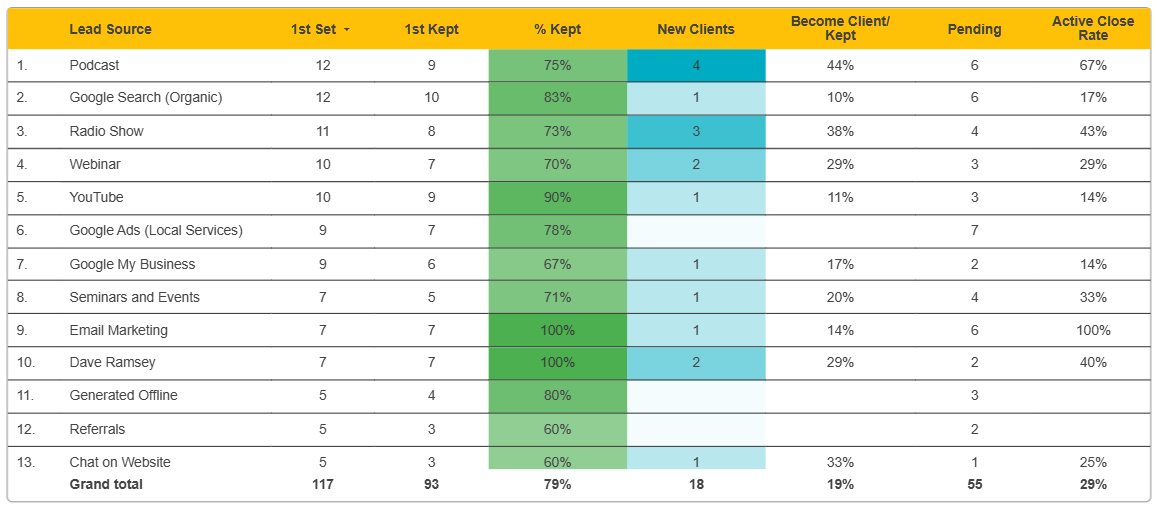
In addition to bar graphs and a pie chart, you’ll see tables displaying the percentage of first appointments based on advisor and source.
1st Appointment by Advisor
This table displays the percentage of kept appointments based on advisor. This enables you to seek a glance into the efficiency of your advisors. The columns here show the percentage of prospects that kept appointments with a specific advisor and how many of them converted or are in pending status.
1st Appointment by Source
This table shows the percentage of appointments based on the source. The columns here display the number of prospects coming from various sources.
List of Appointments
By the end of this report, you’ll see the tabular representation of the list of appointments. This table consolidates all the appointment-related information and provides a holistic view.
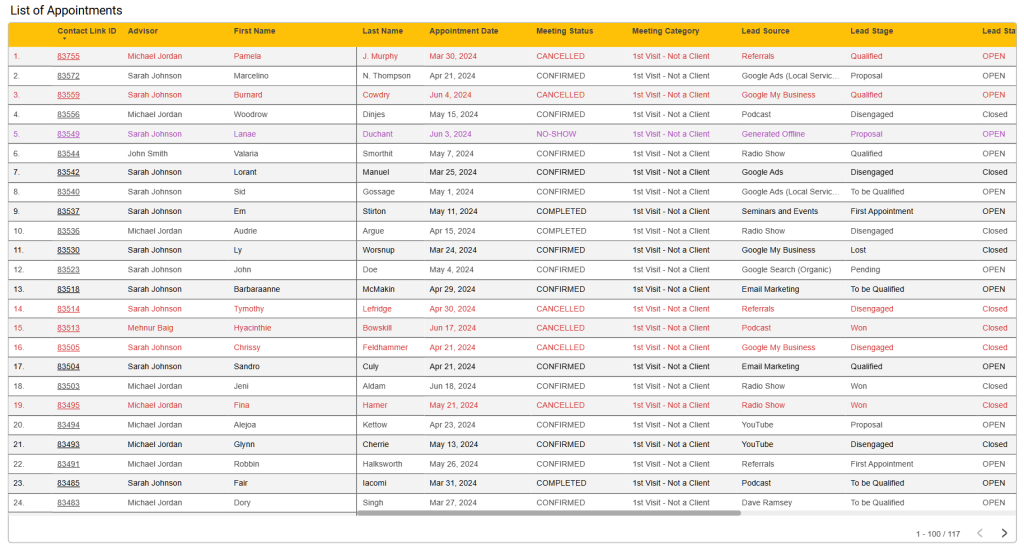
Let’s see the columns in this table:
- Contact Link ID: The clickable lead ID to take you to the lead details page in LeadCenter.
- Advisor: The name of the advisor taking point on the account.
- First Name: The first name of the lead.
- Last Name: The last name of the lead.
- Appointment Date: The date of the first appointment.
- Meeting Status: The status of the meeting. For example, confirmed, completed, or cancelled.
- Meeting Category: The category of the meeting. For example, first meeting, first appointment kept, etc.
- Lead Source: The channels where your leads are originating from.
- Lead Stage: The stage of your lead’s journey.
- Lead State: The open state means that the lead is still in the processing stage while the closed state means that the lead is coveted or lost.
- Won or Lost: The lead is won when they become a client. Otherwise mark it as pending if they're still in the process or lost if they choose to step back.
- Office Location: The location of the office.
- Closed Date: The date when you've won the lead.
- Lead Owner: The advisor managing the leads.
- Created Date: The date when the lead first initiated contact.
