Deals Velocity Report
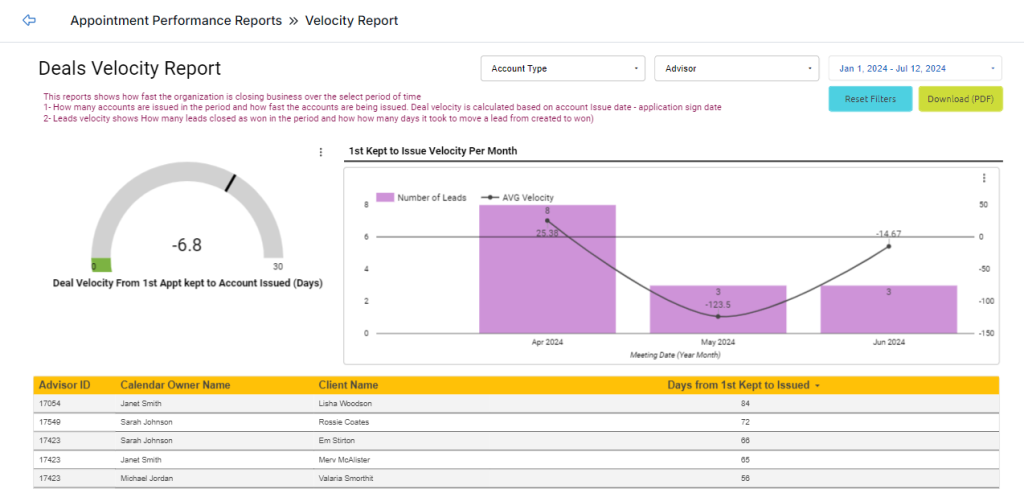
The Deals Velocity Report presents a comprehensive view of how your company finalizes business deals within a specific timeframe. It provides valuable insights into your company’s performance and your ability to convert leads into paying clients within a chosen period of time.
Access the Deals Velocity Report
- Log into your LeadCenter account.
- Click on Reports in the left navigation sidebar.
- Click on Velocity Report in the Appointment Performance Report section.

- You’ll see the Deals Velocity Report dashboard.
Components
This dashboard has different components to showcase your company’s performance regarding the speed of closing deals. Let’s see what these components are:
Filters
You’ll see the filters on top to specify your search.
Account Type
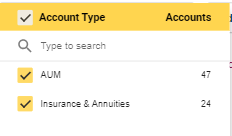
This dropdown allows you to select the account type. You can choose AUM or Insurance and Annuities.
Advisor
Click on this dropdown to select the financial advisor managing the accounts.

Deal velocity index
It represents the average number of days from the first appointment with a lead to the day they become a paying client. It reflects how quickly an efficient advisory practice can convert initial meetings into actionable accounts.
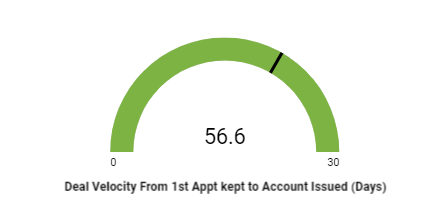
Chart - Deal Velocity From 1st Appt kept to Account Issued (Days)
The deals velocity index is first represented by a half-pie chart or a speedometer. It presents an overall picture of the average speed with which your company is closing deals.
Bar graph - 1st Kept to Issue Velocity Per Month
The bar graph presents a granular view of the number of leads from the first meeting to the average number of days till they issue an account.

Tabular representation of deals velocity by advisor
The table shows columns with advisors' and clients’ names. It offers you a unique insight into your advisors’ professional prowess. You can see which advisors are quickly turning leads into clients with accounts.

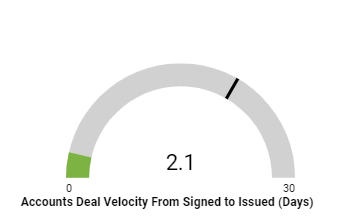
Chart - Accounts Deal Velocity From Signed to Issued (Days)
Scroll down on this dashboard and you’ll find another half-pie chart. This chart displays the duration between a client signing the deal and issuing the investable assets.
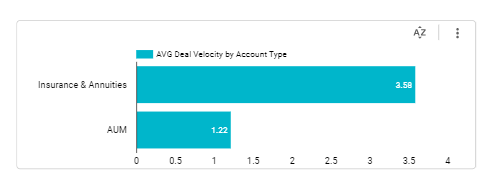
Bar graph - AVG Deal Velocity by Account Type
Next to the half-pie chart, you’ll see a bar graph. It showcases the deal velocity regarding the account type. For example, insurance, annuities, and AUM. It enables you to analyze which of these account types get processed quickly and efficiently.
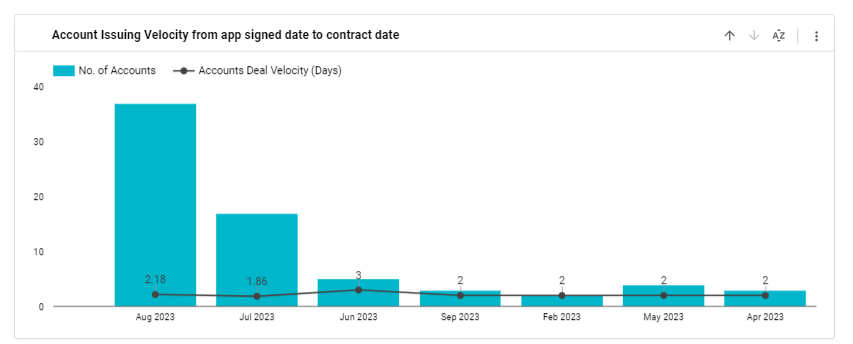
Bar graph - Account Issuing Velocity from app signed date to contract date
This bar graph represents the time it takes to process your client’s application and finalize the contract.
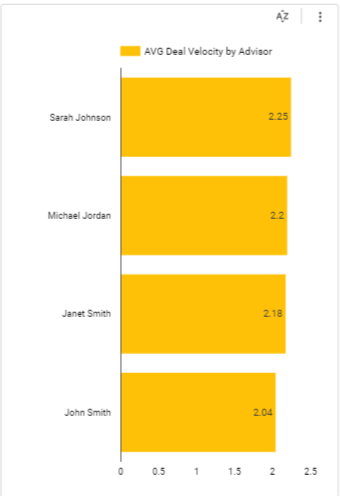
Bar graph - Average Deal Velocity by Advisor
This bar graph displays the number of days it takes for each individual advisor to finalize a deal. It acts as a performance metric for your advisors and allows you to optimize your operations based on high-performing employees.
