Events Report
LeadCenter brings you Events Report so that you can view events-related consolidated data and make decisions based on real-time updates. This report consists of graphs, charts, and metrics to display the efficiency of your business operations and steer you toward making smart choices.
Access the Events Report
Follow the steps given below to access the All Production report:
- Log into your LeadCenter account.
- Click on Reports in the left navigation panel.
- Navigate to Marketing Reports and select Events Report.
- That’s all!

Dashboard components
Upon accessing this report, you’ll see three tabs on the left side. Each tab provides a different kind of report. These tabs are:
- Events Overview
- Attendees
- Expenditure
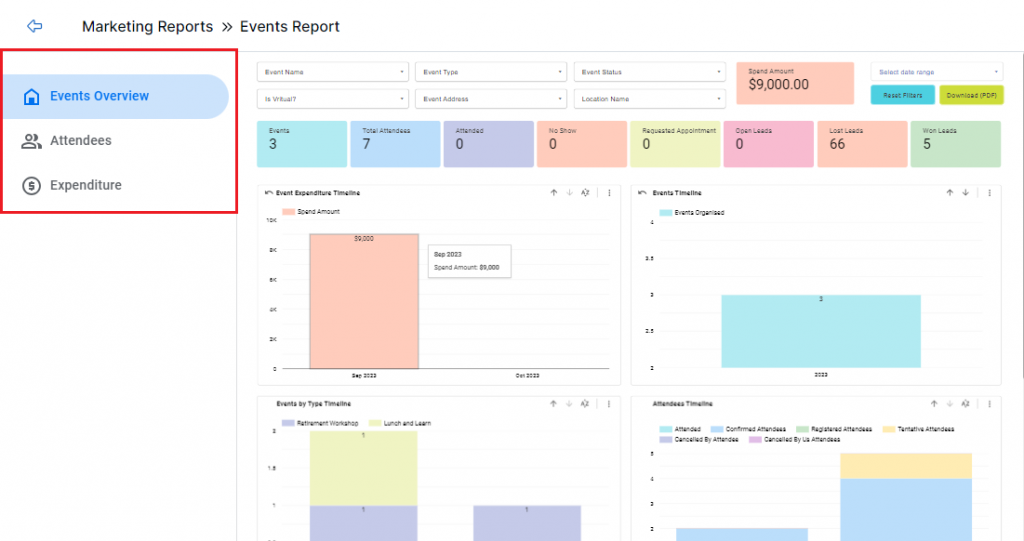
Note: Some of the filters in each tab are the same.
Events Overview tab
You can switch between tabs to see the components specific to each tab.
Let’s see the components of the Events Overview report:
Filters
You’ll see the filters on top of the screen. You can click on the required filter dropdown to specify your search.
Event Internal Name
Use this dropdown to select a specific event by its internal name.

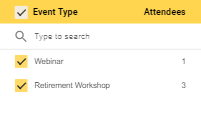
Event Type
This dropdown shows the event types. For example, workshops or seminars.
Event Status
Use this dropdown to see the status of an event. For example, canceled, scheduled, or completed.

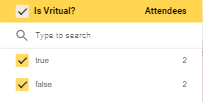
Is Virtual?
Click on this dropdown to see if it was a virtual event.
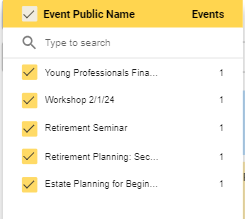
Event Public Name
Use this dropdown to select a specific event by its public name.
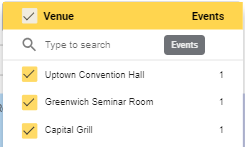
Venue
Use this dropdown to select required event venues.
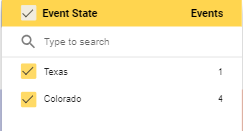
Event State
Use this dropdown to specify your search by the state the event is held in.
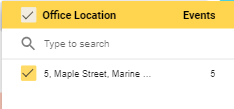
Office Location
Use this dropdown to view the office location where the event is held.
Organizers List
Use this dropdown to view the list of organizers for this event.

Metrics
This tab has various metrics to provide you with a glance into the event turnout. These metrics are:
- Events: The total number of events.
- Total Registered: The total number of people who registered to attend.
- Attended: The total number of people who attended the event.
- Total Cost: The total cost of the event.
- No Show: The number of people who didn’t attend.
- Appt Requested: The number of people who attended and requested a first appointment.
- Appt Scheduled: The number of people who scheduled or booked the appointment.

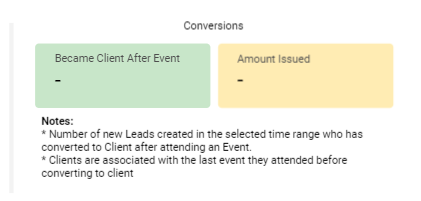
Conversion metrics
In addition to the above metrics, you'll see the conversion metrics here:
- Became Client After Event: The number of people who became client after attending an event.
- Amount Issued: The amount issued by client.
Bar graphs
You’ll see different event statistics displayed in bar graphs. Let’s take a look at these graphs:
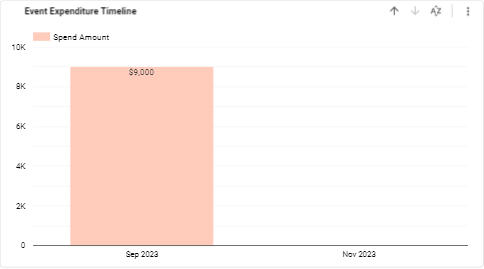
Event Expenditure Timeline
This graph shows the total amount spent on an event and its breakdown by month or year.
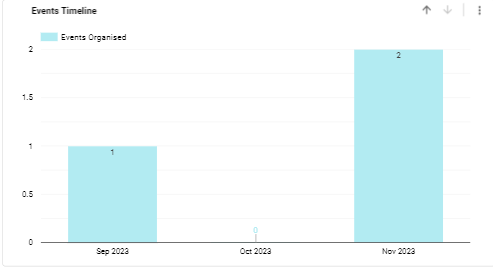
Events Timeline
This graph shows how many events you organized per month or year.
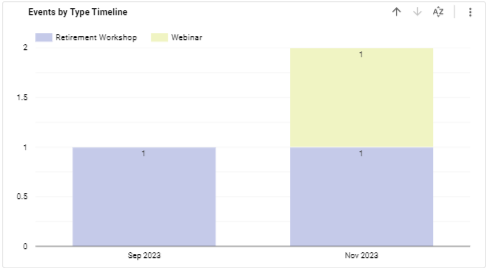
Events by Type Timeline
This graph displays the event type regarding the month or year it was organized. The event type is color-coded for easy interpretation.
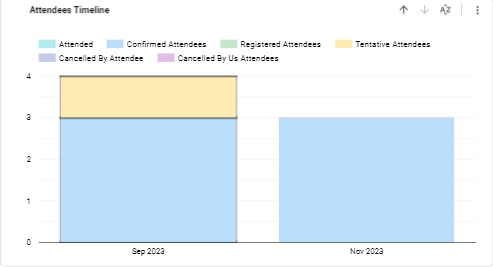
Attendees Timeline
This graph displays the people who registered to attend an event. You can see different attendee statuses such as confirmed, canceled, and attended. These statuses are color-coded for better understanding.
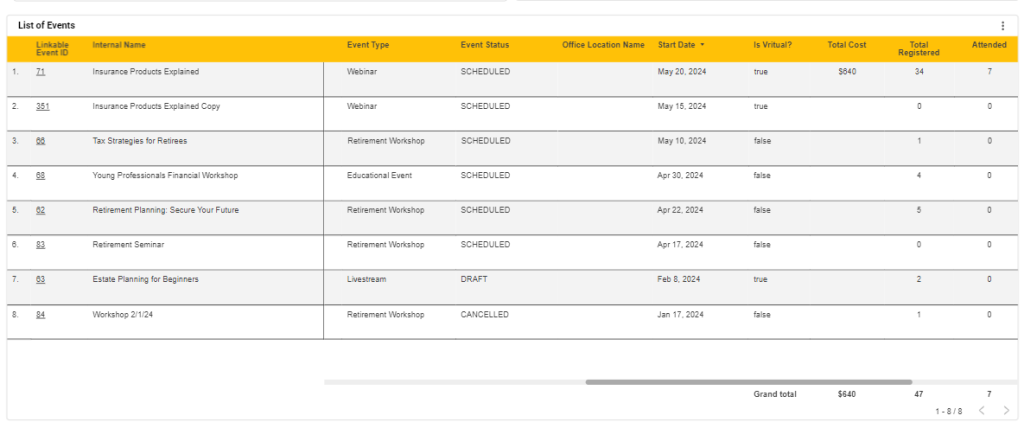
List of Events
By the end of this report, you’ll see the List of Events. it is a tabular representation of all event-related details. You can see these columns here:
- Linkable Event ID: The clickable event ID to take you to the event details.
- Internal Name: The internal name assigned to the event.
- Public Name: The name of the event for public view.
- Venue Name: The name of the event venue.
- Organizers List: The names of event organizers.
- City: The city where the event is taking place.
- State: The state where the event is held.
- Event Type: The type of the event. For example, a workshop.
- Event Status: The status of the event. For example, scheduled.
- Office Location Name: The location of the event office.
- Start Date: The start date of the event.
- Is Virtual?: If the event is a live stream or happening in person.
- Total Cost: The total cost of the event.
- Total Registered: The total number of people who registered to attend.
- Attended: The number of people who attended.
- Requested Appointment: The number of people who requested first appointment.
- No Show: The number of registered people who didn't attend.
- Organizers: The number of organizers for an event.
Attendees
Switch to this tab and you’ll find the total number of attendees. This report provides an extensive view of all attendees based on the status of their attendance, the sources they’re coming from, and the stage of their buyer’s journey.
Filters
Let's see the description of filters specific to this tab:
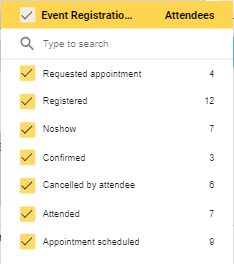
Event Registration Status
Use this dropdown to see the specific registration status of your leads. For example, registered, no show, confirmed, etc.
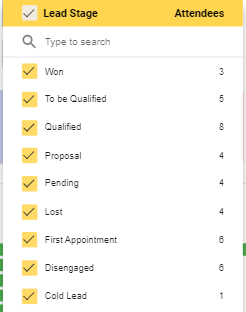
Lead Stage
Use this dropdown to select the stage of a lead’s journey. You can customize the lead stages as required.
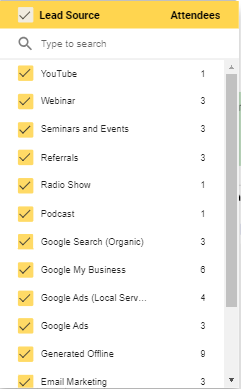
Lead Source
Use this dropdown to select the channels that your leads are coming from. For example, a YouTube ad prompted a lead to register for the event.
Client Status
Use this dropdown to see if this client is a new lead or an existing one.

Head of Household
Use this dropdown to see the leads who are decision makers.

Metrics
The metrics here are same as the Overview tab:
- Total Registered
- Attended
- No Show
- Requested Appointment
- Appointment Scheduled

Bar graphs
You’ll find three bar graphs in this report.
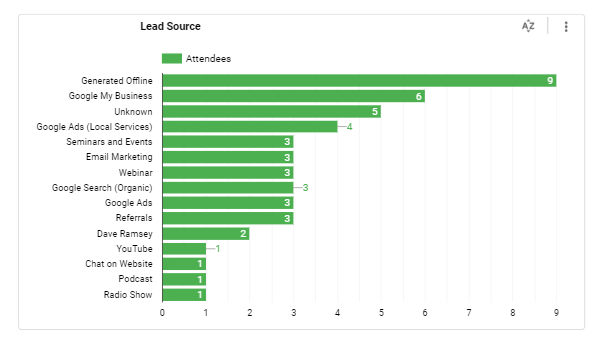
Lead Source
You can see where your leads are generated from. It provides you with a holistic view of digital and traditional channels and helps you direct your marketing efforts accordingly.
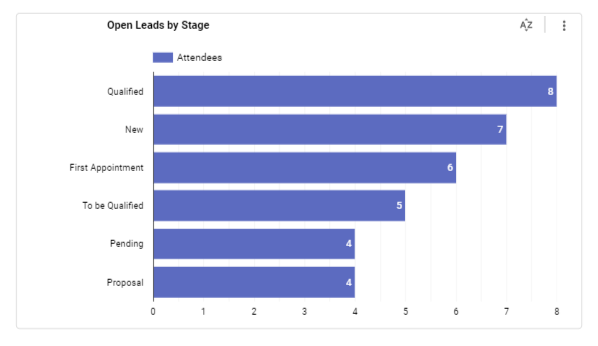
Open Leads by Stage
This is where you can see the stage of your lead’s journey. For example, they book a first appointment with you.
Tables
After the graphs, you’ll see the following two tables:
- Open Leads Stages Per Event and Stage
- List of Attendees
Open Leads Stages Per Event and Stage
This table helps you view each event by the number of generated leads in different lead stages. You’ll find information in different columns:
- Event Public Name
- To be Qualified
- Qualified
- Proposal
- Pending
- New
- First Appointment
- Grand Total

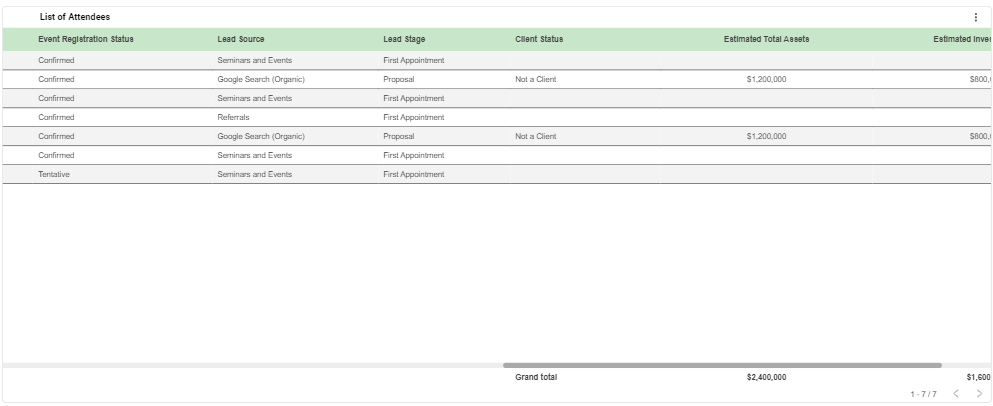
List of Attendees
This is the tabular representation of the list of attendees. You’ll find information in different columns:
- Linkable Lead ID: The clickable lead ID to take you to the lead details page in LeadCenter.
- Name: The name of the attendee.
- Email: The email address of the attendee.
- Phone: The phone number of the attendee.
- Event Public Name: The name of the event.
- Office Location: The location of the event office.
- Attendee Registration Date: The date when the attendee registered to attend.
- Lead Source: The channel where the leads are coming from.
- Lead Stage: The stage of a lead’s journey.
- Client Status: Whether this lead is an existing client.
- Lead Creation Date: The day when you acquired this lead.
- Lead Closed Date: The day when this lead went cold.
- Event Type: The type of the event. For example, a workshop.
- Event Status: The status of the event. For example, scheduled.
- Event Date: The start date of the event.
- Event Registration Status: The attendance status of the attendee. For example, confirmed or tentative.
- Estimated Total Assets: The estimated value of the lead’s assets.
- Estimated Investable Assets: The estimated value of the lead’s investable assets.
Expenditure
Switch to this tab and you’ll find the total cost of the required event. This dashboard displays the total amount spent and provides a comprehensive view of event-related expenditures.
Filters
All the filters in this tab are same as the Overview tab except one.
Marketing Spend Category
Metrics
You’ll find these metrics here:
- Events: The total number of events.
- Spend Amount: The total amount spent on all events.

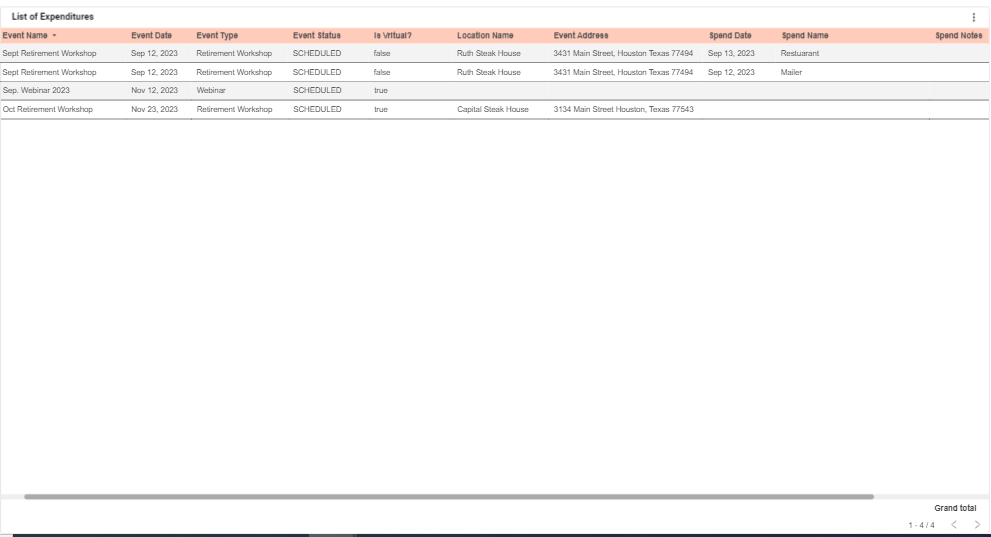
List of Expenditures
You’ll find the tabular representation of the list of expenditures in this report. The different columns showcase the following information:
- Event Name: The name of the event.
- Event Date: The start date of the event.
- Event Type: The type of the event. For example, a workshop.
- Event Status: The status of the event. For example, scheduled.
- Is Virtual?: If the event is a live stream or happening in person.
- Venue Name: The name of the venue where the event is held.
- Event Address: The complete address of the event location.
- Event City: The city where the event is taking place.
- Office Location Name: The location of the event office.
- Event State: The state where the event is held.
- Spend Date: The date when the event payment was made.
- Spend Name: The name of the expense. For example, money spent on food and drinks.
- Spend Notes: The notes, if any, regarding the payment.
- Marketing Spend Category: The name of the marketing channel or source you spent money on.
- Spend Amount: The amount spent on a particular expenditure.
